My Crypto Dashboard Tells Me More Than Binance Ever Could—So I Could Stop Guessing and Built This
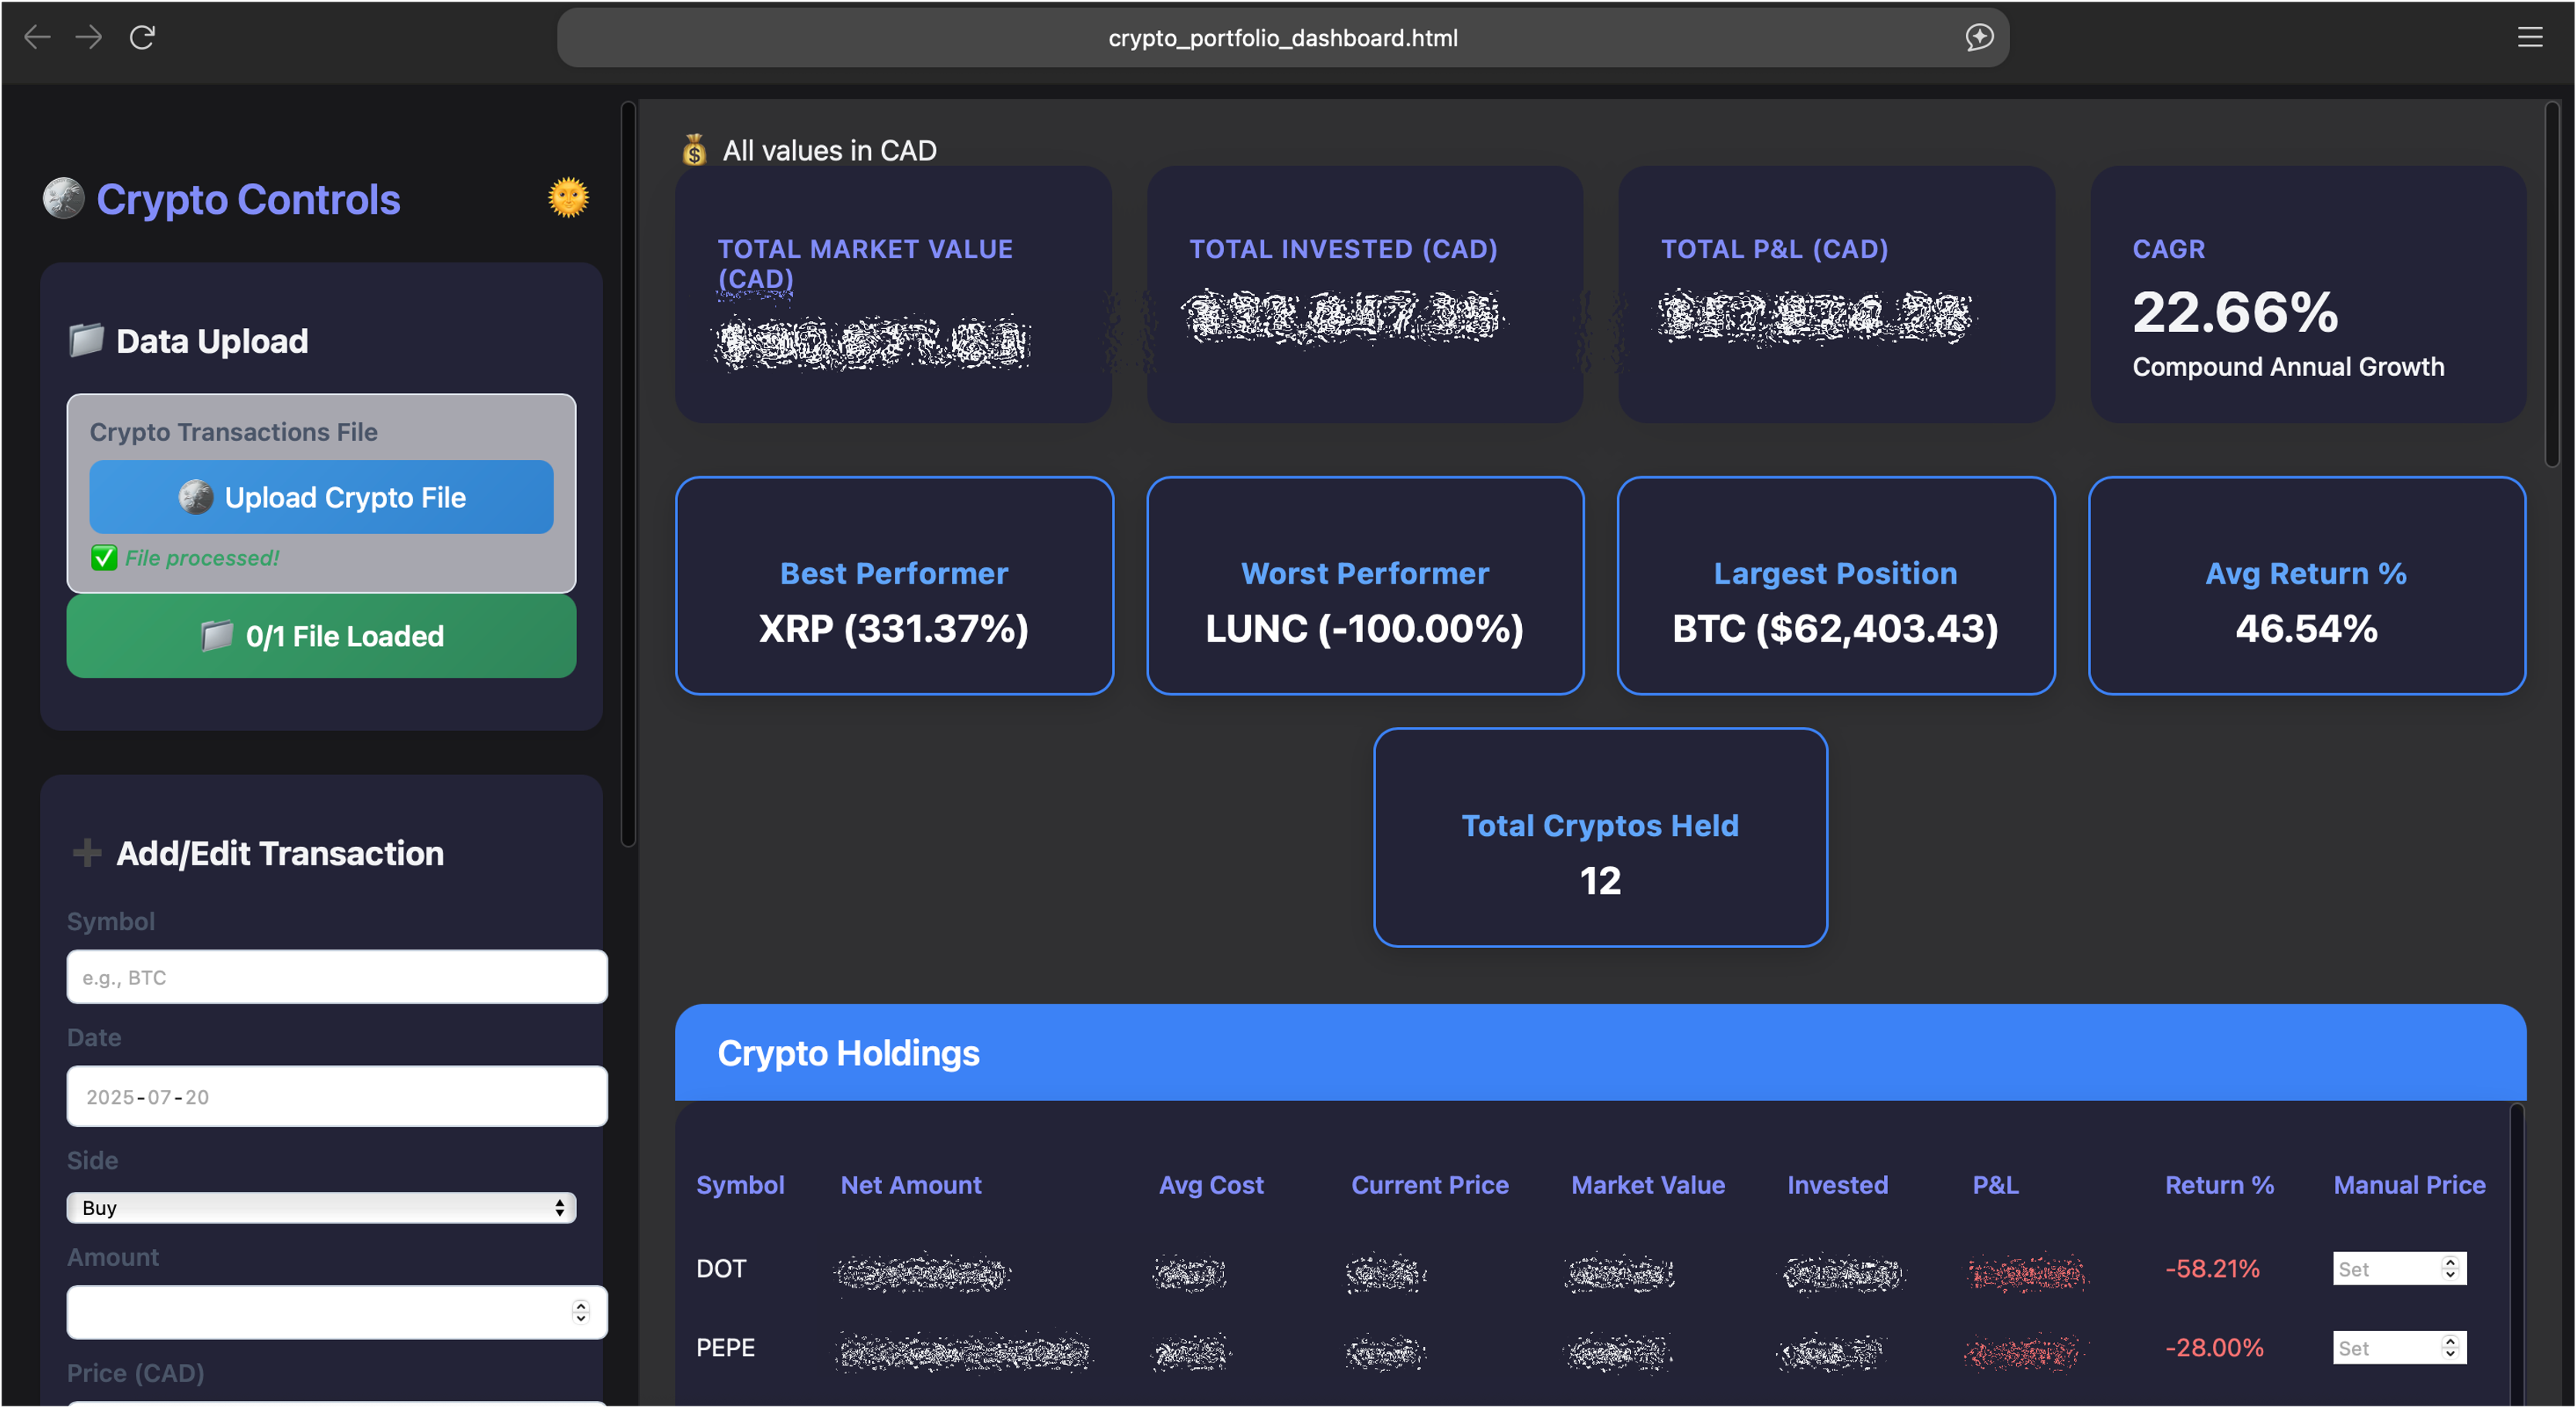
At-a-glance performance: Instantly see your total market value, invested amount, P&L, CAGR, and top performers. No more guessing—just clear, actionable numbers.
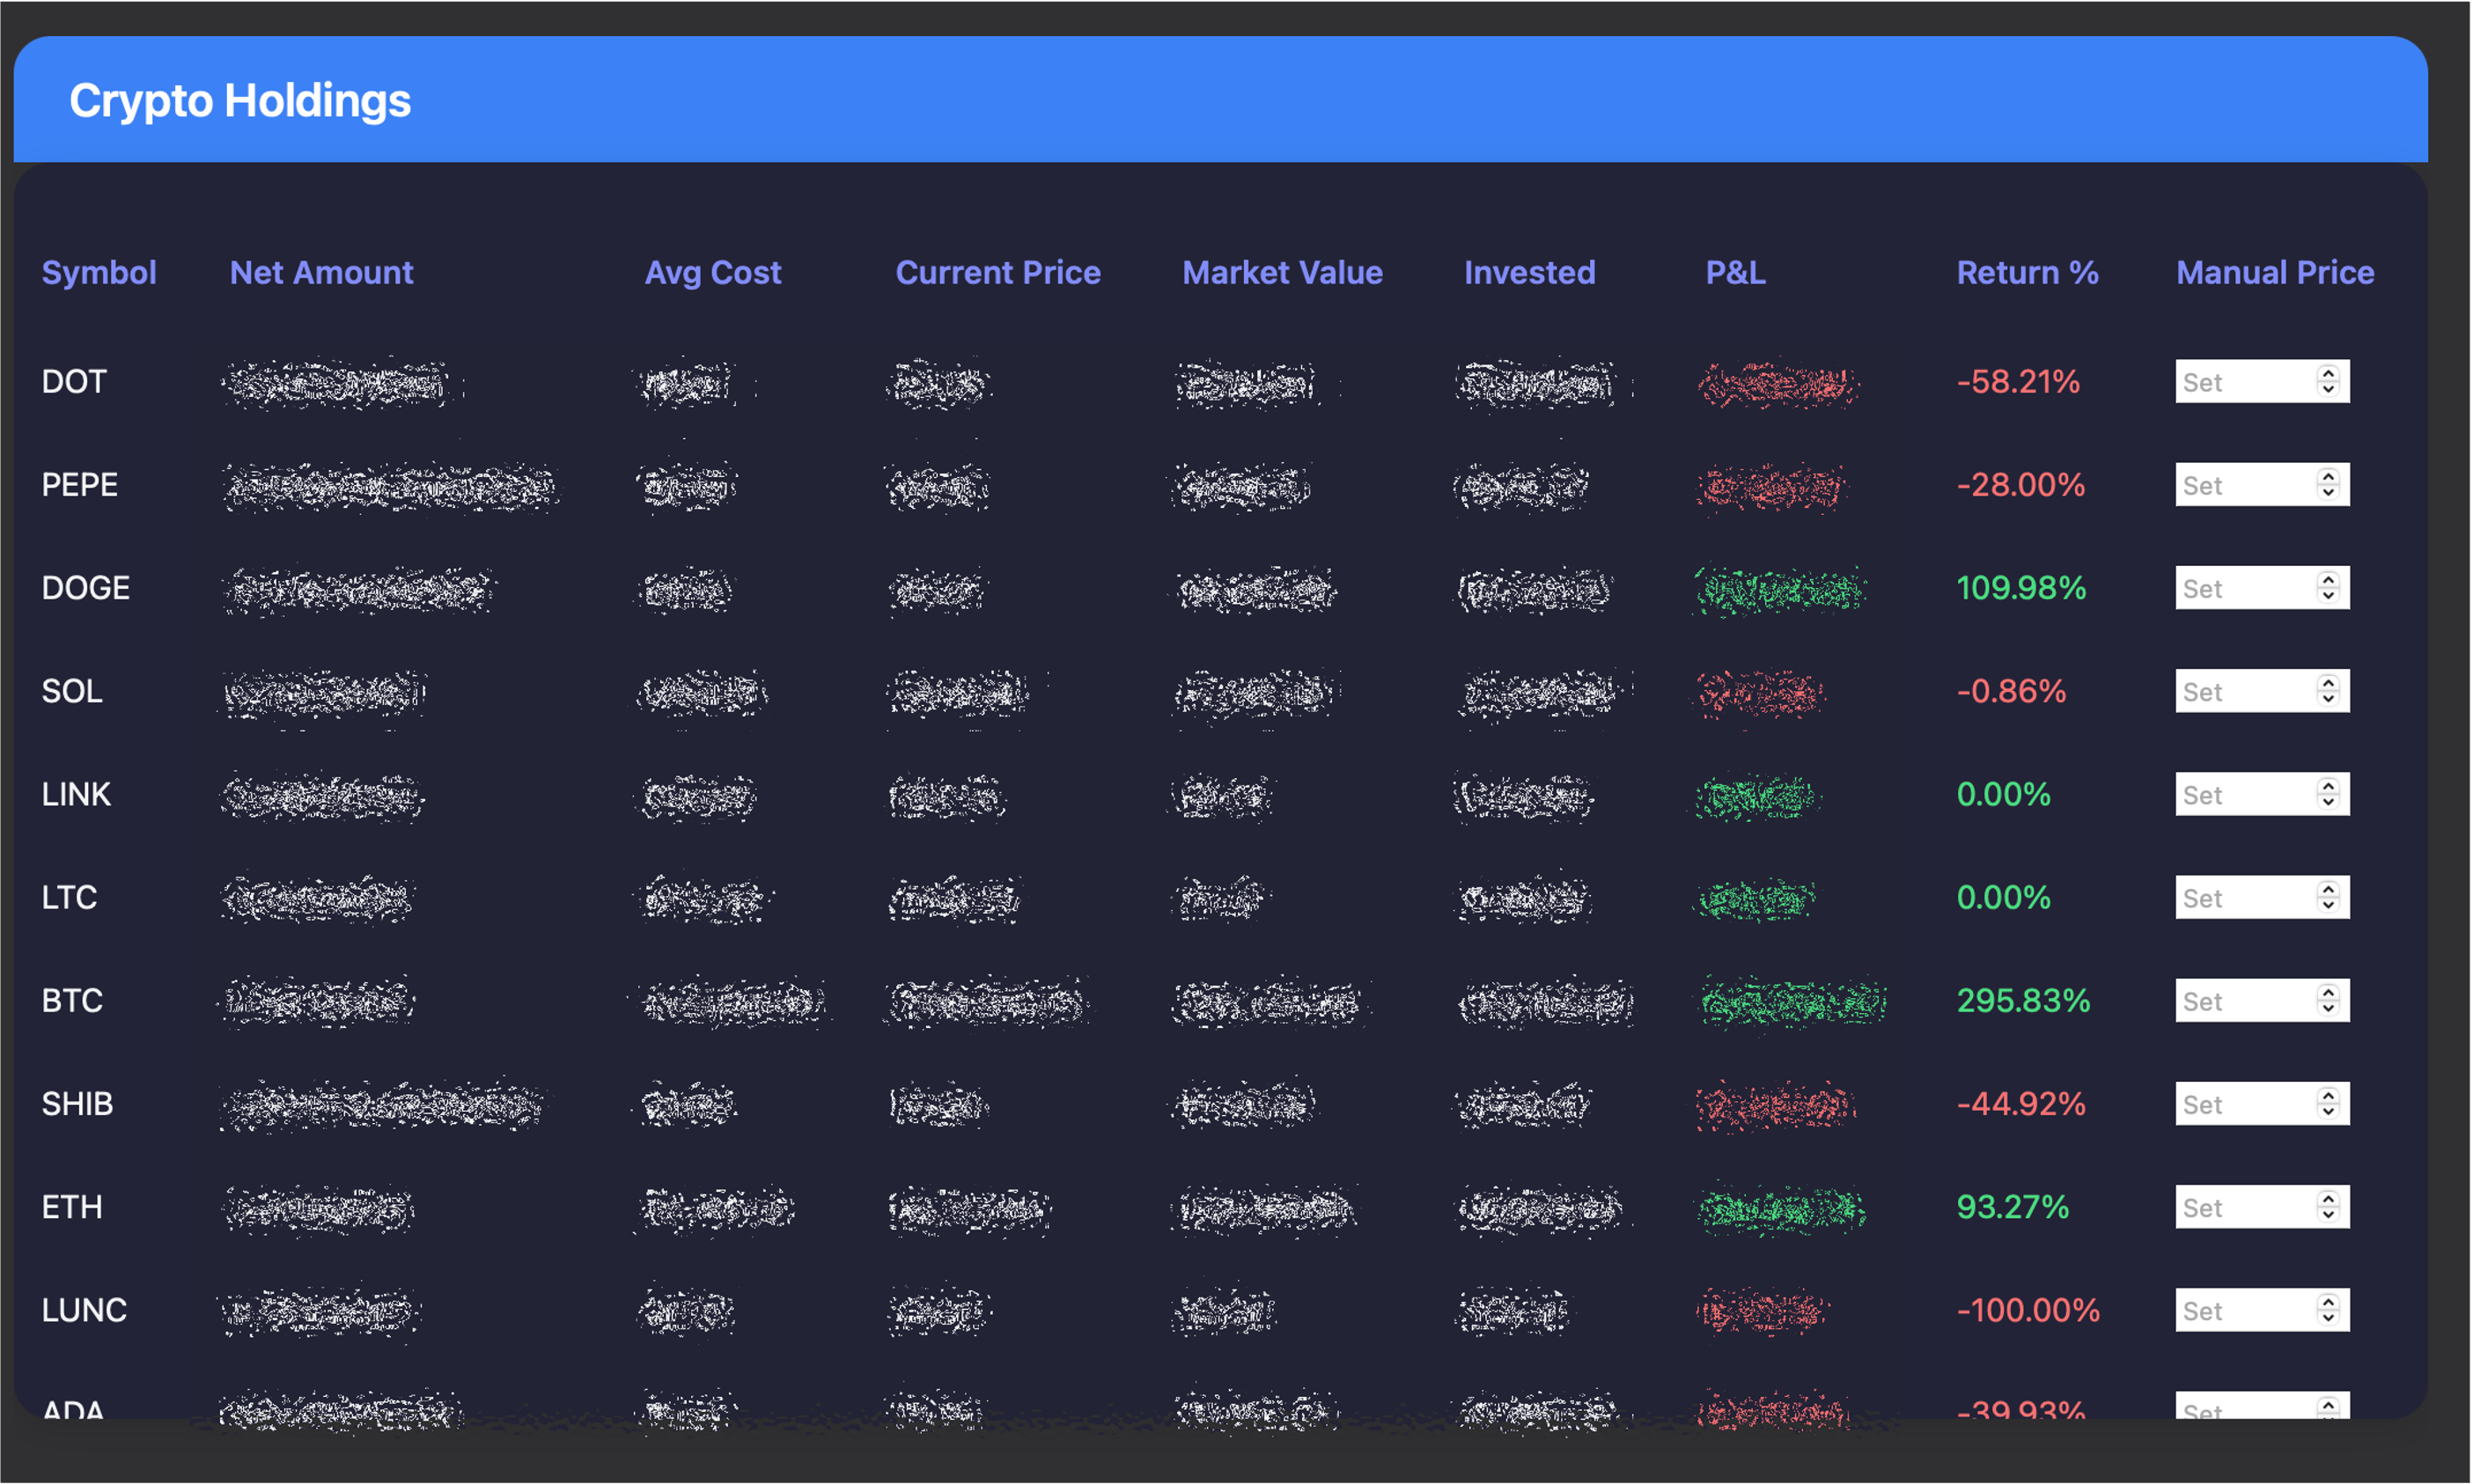 Comprehensive holdings: Track every coin, net amount, cost, market value, and returns in a clean, sortable table. Because crypto shouldn't be a mystery.
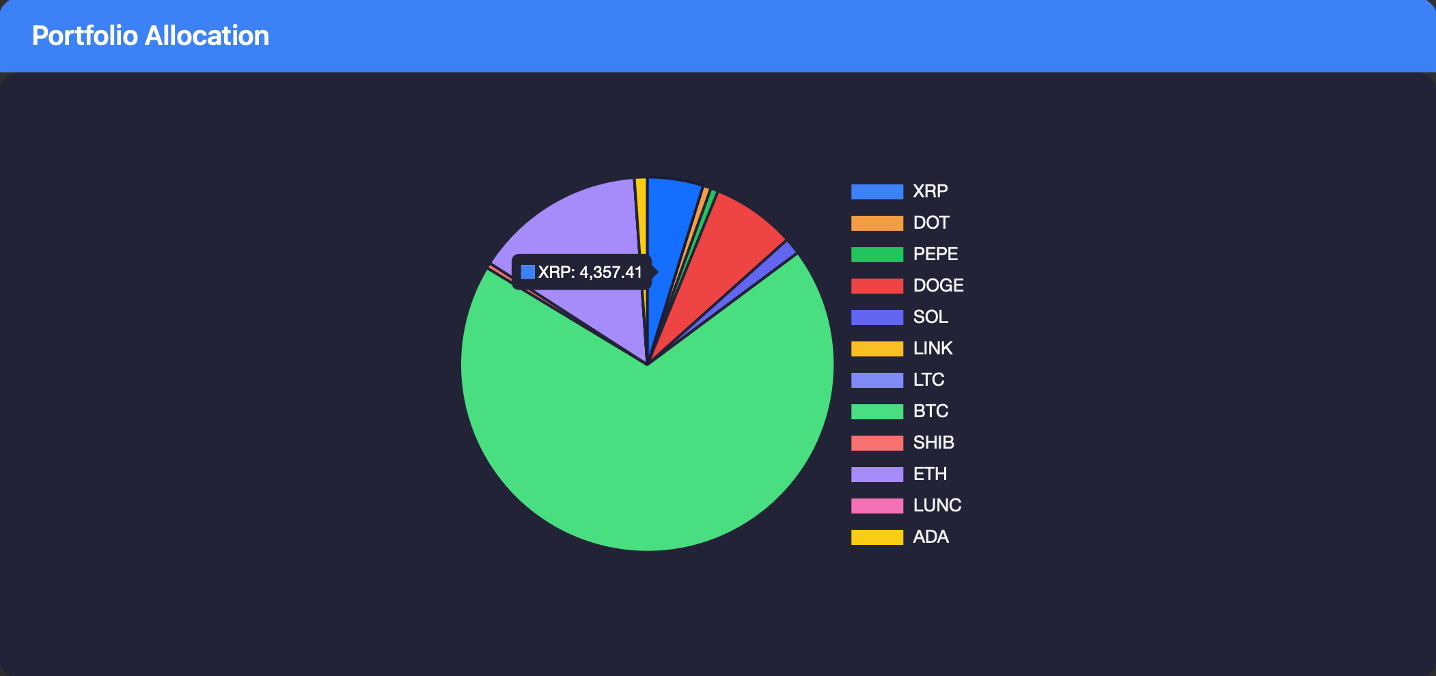 See your allocation: Instantly visualize your portfolio breakdown by token with a color-coded pie chart. Perfect for spotting over-concentration or missed opportunities.
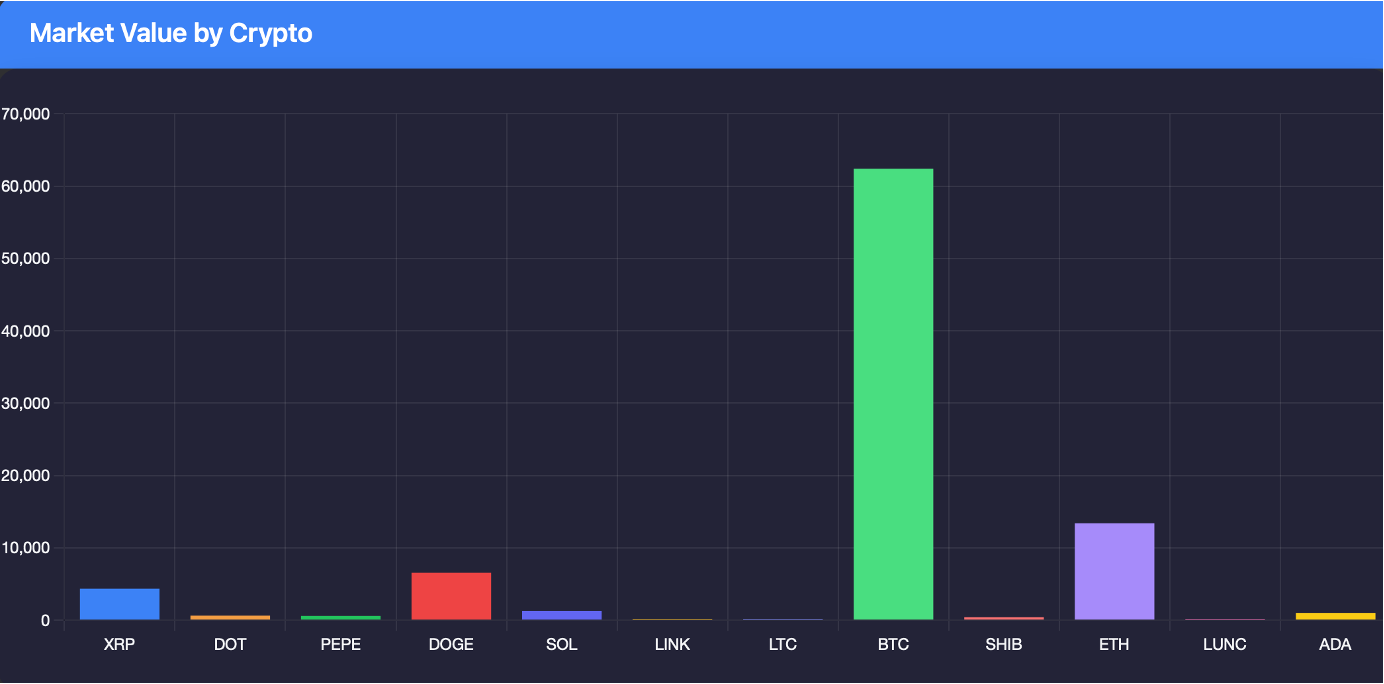 Market value breakdown: Compare the current worth of each token in your portfolio. Because not all cryptos are created equal—some are worth more than others.
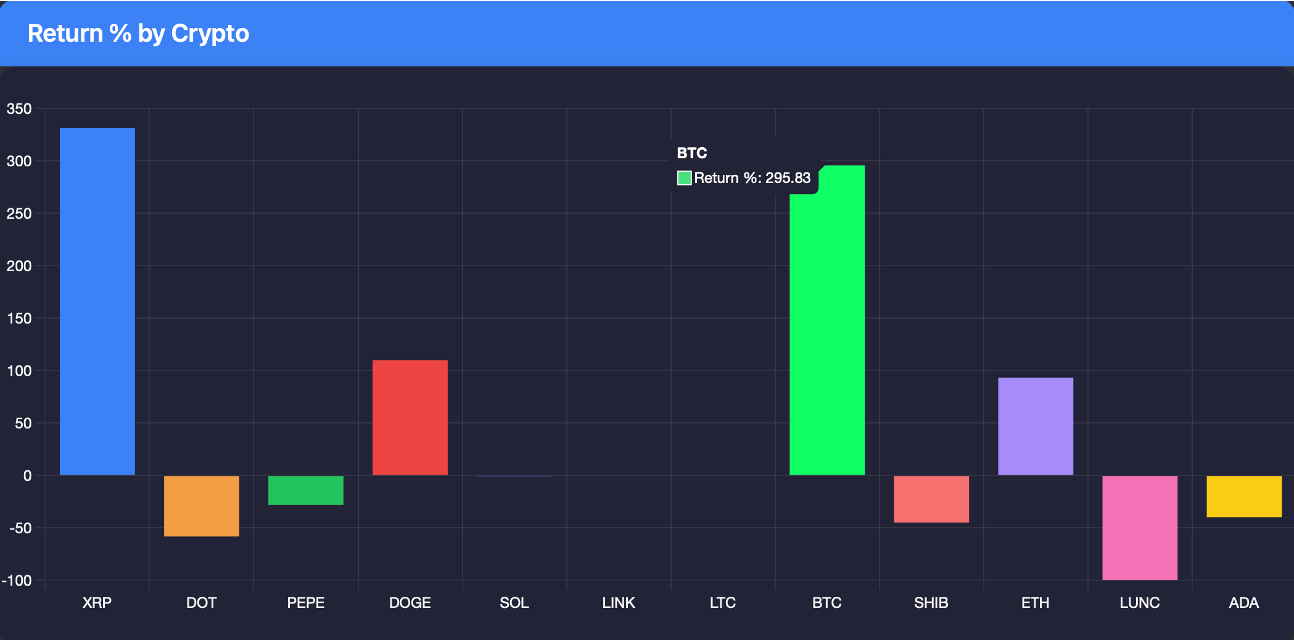 Returns by token: See which cryptos are your winners and which ones are... learning experiences. Clear, actionable insights for your next move.
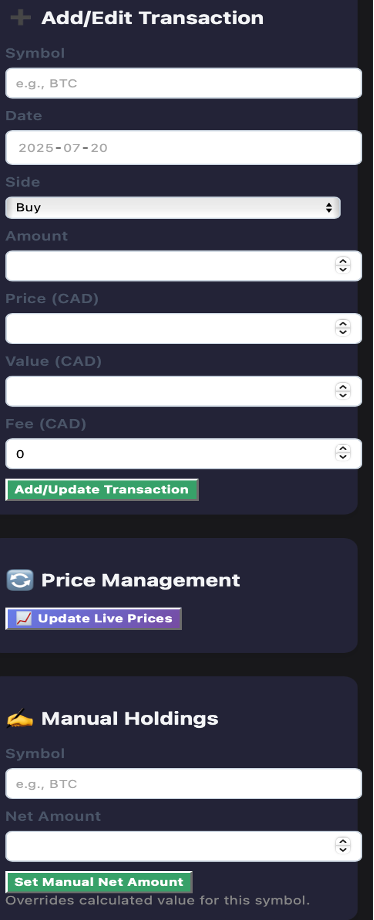 Ultimate control: Enter prices manually if needed, add transactions, and analyze returns by token with clear, actionable charts. Because sometimes you need to fix what the APIs got wrong.
"My Crypto Dashboard Tells Me More Than Binance Ever Could—So I Stopped Guessing and Built This"
⸻
🧠 The Why (Problem)
Crypto investing is already volatile. The last thing I need is a dashboard that gives me vibes instead of insights.
When I tried tracking my crypto investments across platforms—Coinbase, Binance, random cold wallets, Excel sheets—I was met with:
- Missing data,
- No idea of true profit/loss, and
- A pile of trades that made it feel like I was playing 3D chess blindfolded.
All I wanted was:
- What I bought
- When I bought it
- For how much
- And what it's worth today
So… I built the dashboard I couldn't find anywhere.
⸻
✨ What I Built
This dashboard is like a crypto accountant, but without the judgment.
- 📂 Upload your crypto trades (.csv, .xlsx)—from any exchange
- 🧮 Instantly get net holdings, average cost, and current value
- 📈 Live price updates from CoinGecko, Binance, Coinbase (with fallback logic)
- 🔄 Manual price overrides if APIs misbehave
- 💸 Auto-calculated P&L and CAGR
- 🧾 Add/edit individual trades manually
- 📊 Beautiful summary cards, bar charts, and a pie chart of allocation
- 🌗 Dark mode to match your existential market moods
⸻
😬 The Struggles I Faced (aka: Why Crypto Bro Tools Didn't Work for Me)
You'd think building a dashboard was just a few tables and charts. You'd be wrong.
⚠️ 1. Live Price Hellscape
Unlike stocks, there's no single source of truth for crypto prices. I had to:
- Scrape CoinGecko (80% reliable)
- Fallback to Binance and Coinbase APIs (which rate-limit and occasionally ghost you)
- Convert everything into CAD
Solution: I wrote a failover chain. CoinGecko → Binance → Coinbase. Still failing? Prompt the user to enter the price manually like a rebel.
⸻
💱 2. Forex: Again. Because Crypto.
Even if I bought in USDT or BTC, I wanted to see my total value in CAD. That meant:
- Handling conversion at the right time (not today's rate)
- Keeping things consistent for CAGR and P&L
Solution:
- CAD conversion logic baked in
- Manual override for control freaks (like me)
⸻
🧮 3. Transaction Chaos
Some trades came in .csv, others in .xlsx. Some had columns like PAIR, others used SYMBOL.
Solution:
- Flexible parsing logic using SheetJS
- Smart recognition of symbol, amount, side (BUY/SELL), value, price, and fees
- Error messages with sass if the file was broken
⸻
🧾 4. Manual Holdings Control
Sometimes I wanted to override the calculated holdings (especially for assets not actively traded or moved to cold storage).
Solution:
- Manual Holdings tab with input fields
- Updates real-time performance KPIs and charts
⸻
📊 5. Making It Look… Not Like a Spreadsheet
Crypto data is messy. I wanted to visualize it:
- Pie chart for allocation
- Bar charts for returns and market value
- Clean tables with alt-row colors and hover states
Solution:
- Used Chart.js with a bright color palette
- Built light/dark themes
- Designed it to be responsive on mobile/tablet (trading insights on the go!)
⸻
😎 What Makes This Different
There are tools out there—but they're:
- Too technical (for devs only)
- Too clunky (hello, 2007 UI)
- Too centralized (do I really want to sync my wallets with your cloud?)
This dashboard:
- Runs locally
- Works offline
- Gives instant insights
- Is fully customizable
- Doesn't store your data (privacy FTW)
👨💻 For the Developers
- Frontend: HTML, CSS (Custom), JavaScript (no frameworks)
- Libraries: Chart.js, SheetJS
Features:
- Multi-API price fetching with failover logic
- Flexible CSV/XLSX parsing for various exchange formats
- Real-time CAD conversion with manual override
- Local storage for manual entries and preferences
- Responsive design with dark/light themes
- Offline-first architecture for privacy and reliability